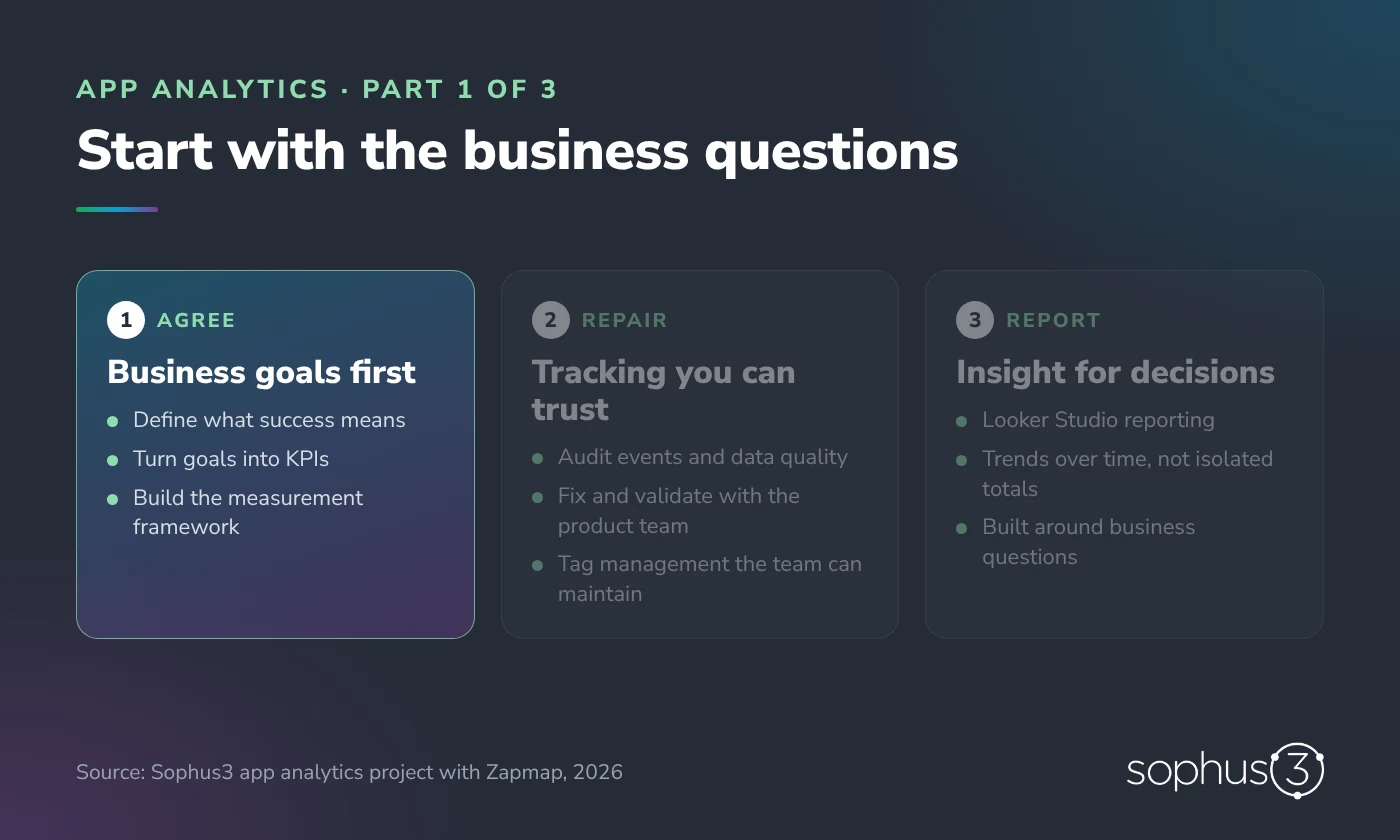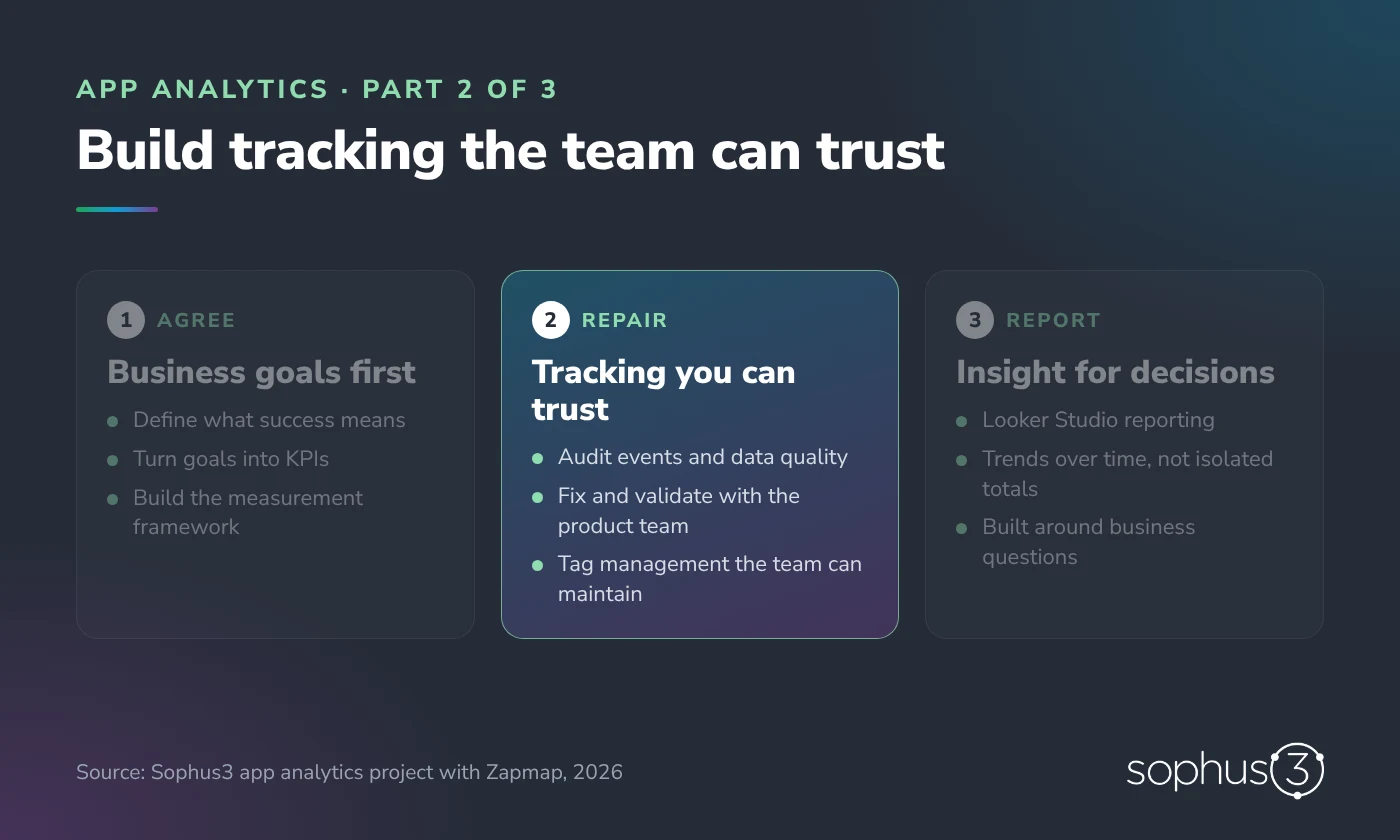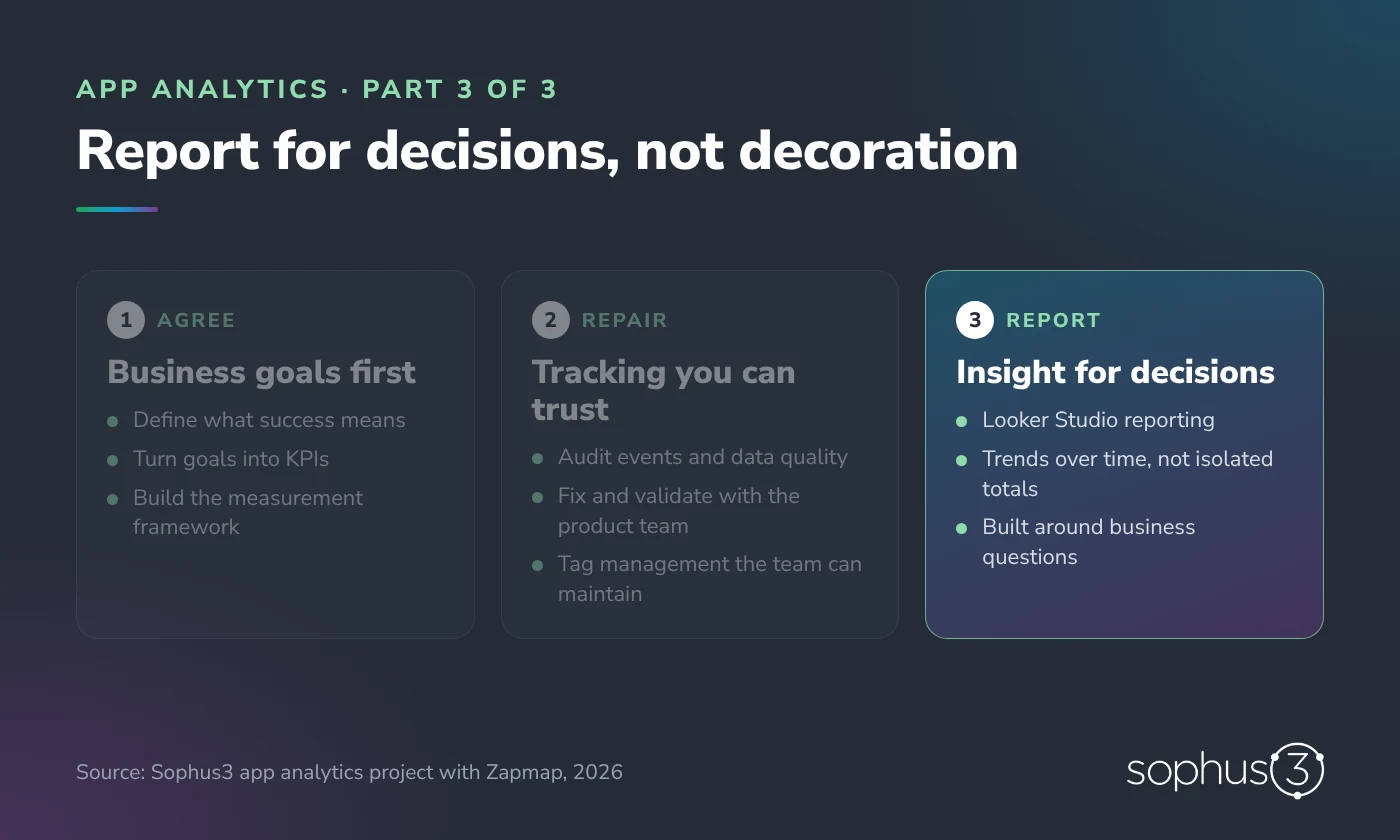
Reporting is only as useful as the tracking beneath it, and tracking is only as useful as the question it answers. Zapmap’s project worked in that order.
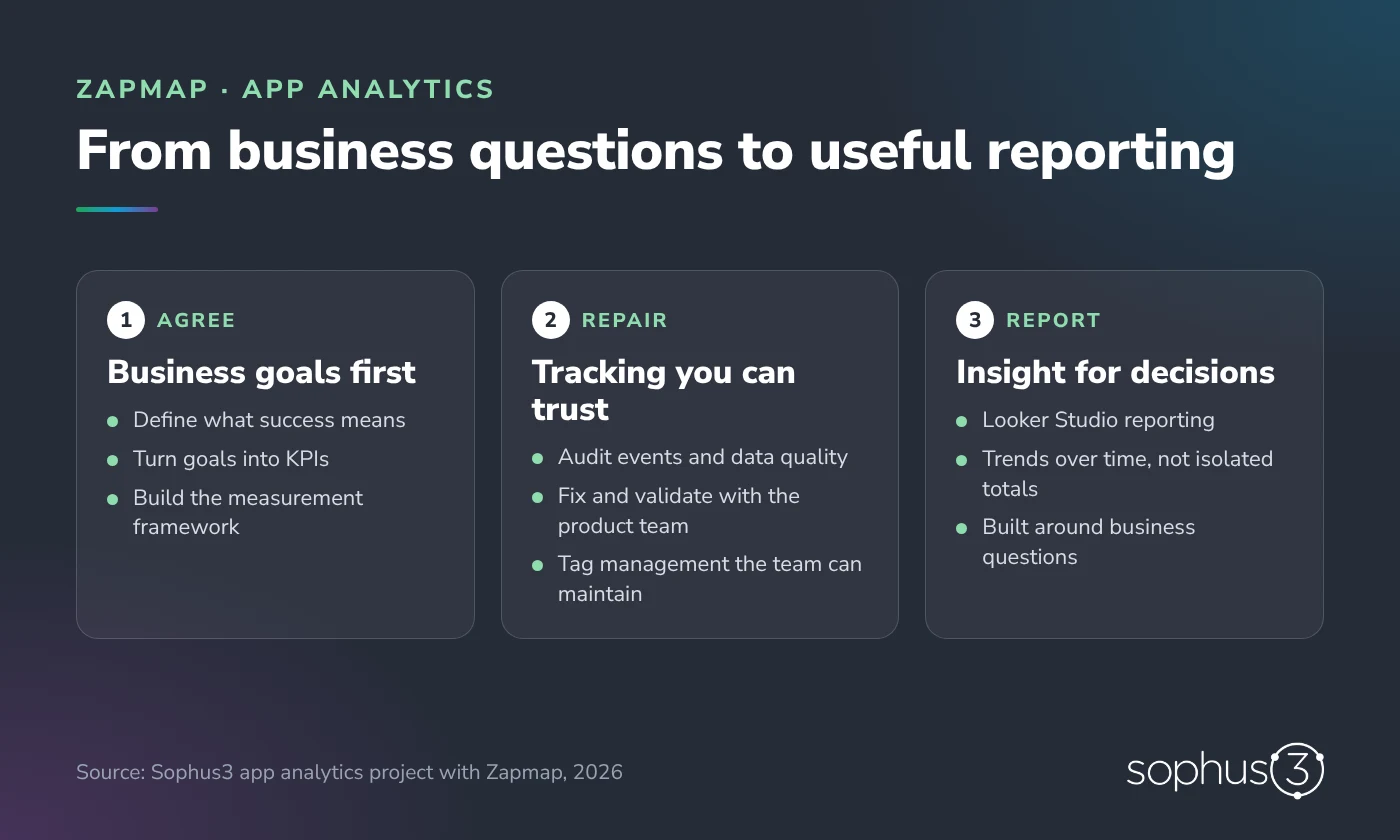
Business goals → validated tracking → useful reporting.
In this insight
About the projectStage 1: agree what success meansStage 2: repair and validate the trackingStage 3: report for decisionsWhat changedLessons for any app or website teamRead the seriesAbout the project
Zapmap’s app helps electric-car drivers in the UK find and use public charge points. Its product team, led by Edmund Walsh, wanted analytics connected to the business priorities it was being asked to deliver. Sophus3 began by agreeing what success looked like, rather than starting with a dashboard.
Stage 1: agree what success means
It is tempting to begin with tag management or a new dashboard. Without agreement on what success means, those tools simply produce more numbers. So the work started with the organisation’s objectives:
- Discuss the business goals and define success for the app.
- Translate those goals into a small set of clear KPIs.
- Build a measurement and reporting framework to guide the audit.
We then compared intent with experience. Does the customer journey in the app support the goals? Does the tracking capture the actions that matter? Mapping the existing tools, implementation guides and dashboards exposed missing events, inconsistent definitions and unreliable reports.
Stage 2: repair and validate the tracking
With the goals agreed, we audited the existing tracking and identified where it was not performing as expected. Working closely with Zapmap’s product team, we tested and validated each new implementation against real app behaviour. The priorities were:
- Tracking that connects directly to the agreed goals.
- Tag management that the team can maintain itself.
- Data that decision-makers can rely on, not only data specialists.
The product team’s knowledge of the app was essential here. Implementation is not finished because a tag exists; it is finished when the data reflects what users actually do.
Stage 3: report for decisions
Good tracking is necessary, but it is not the finish line. We built Looker Studio reporting that connects the data with Zapmap’s business priorities:
- Key measures that are easy to read and tied to business questions.
- Trends over time, so the team can investigate change rather than review isolated totals.
- One shared view that stakeholders can discuss without reconstructing what each event means.
What changed
The project connected tracking and reporting with the questions stakeholders needed to answer, and made clear what was working, what was missing and what needed attention. The team now has a shared basis for discussing what users are doing and which changes to investigate. The published series did not quantify revenue or conversion uplift; its evidence is the measurement approach the team now uses.
Lessons for any app or website team
- Agree the decision before choosing the tool.
- Treat tracking as unfinished until it has been tested against real user behaviour.
- Design reports around questions and trends, not page counts.
- Keep the product team involved; they know what the data should show.
Read the series
Planning an app or website measurement project? Talk to our analytics team.
Based on Sophus3’s three-part project series published on 17 March, 25 March and 2 April 2026. The project did not publish revenue or conversion figures.