Decide what you will do with the answer before you measure. Then judge the campaign against the market, not against itself.
In this insight
The framework in seven stepsStep 1: Start with the decisionStep 2: Map the buying journey to observable signalsStep 3: Choose KPIs for each stage, and one that decidesStep 4: Set the baseline and the competitive contextStep 5: Pick a method that can show causeStep 6: Fix tracking and consent before launchStep 7: Report for the next decisionA worked example: an EV model launch in three marketsPre-launch checklistMistakes we see most oftenTalk it throughThis guide is for brand, national sales company and agency teams who need to show what an automotive digital campaign changed. It draws on more than twenty years of Sophus3 work measuring car-buyer behaviour across European markets: eDataXchange benchmarking of more than 500 automotive websites, independent TV and streaming attribution, and analytics projects for manufacturers and the apps and publishers around them.
It is written around one question we are asked often: how do you build a measurement framework for an automotive brand or model campaign that people will actually use to make decisions?
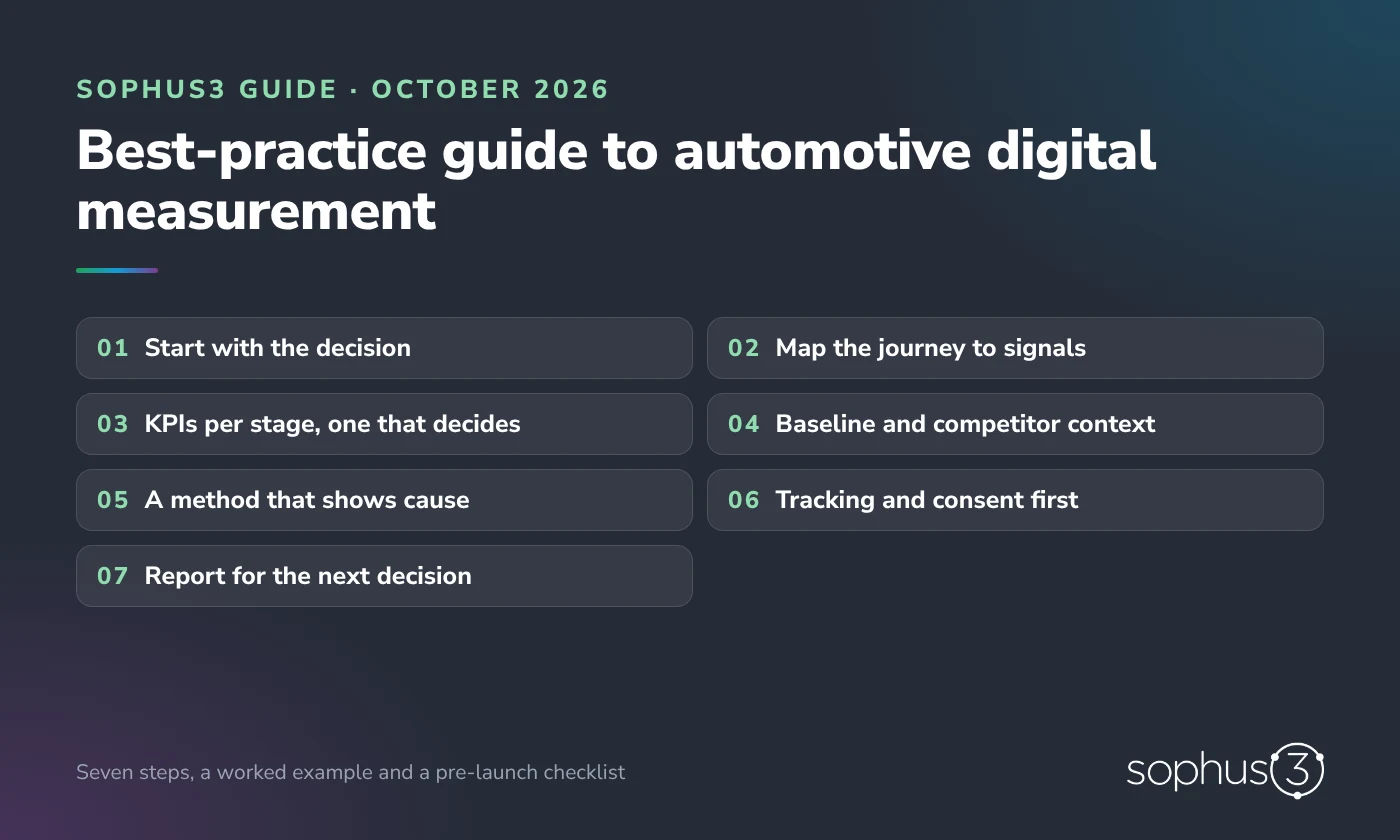
The framework in seven steps
- 1. Start with the decision, not the dashboard.
- 2. Map the buying journey to signals you can observe.
- 3. Choose KPIs for each stage, and one metric that decides.
- 4. Set the baseline and the competitive context before launch.
- 5. Pick a method that can show cause, not just correlation.
- 6. Fix tracking and consent before the first impression.
- 7. Report for the next decision, including when the answer is “not yet clear”.
Step 1: Start with the decision
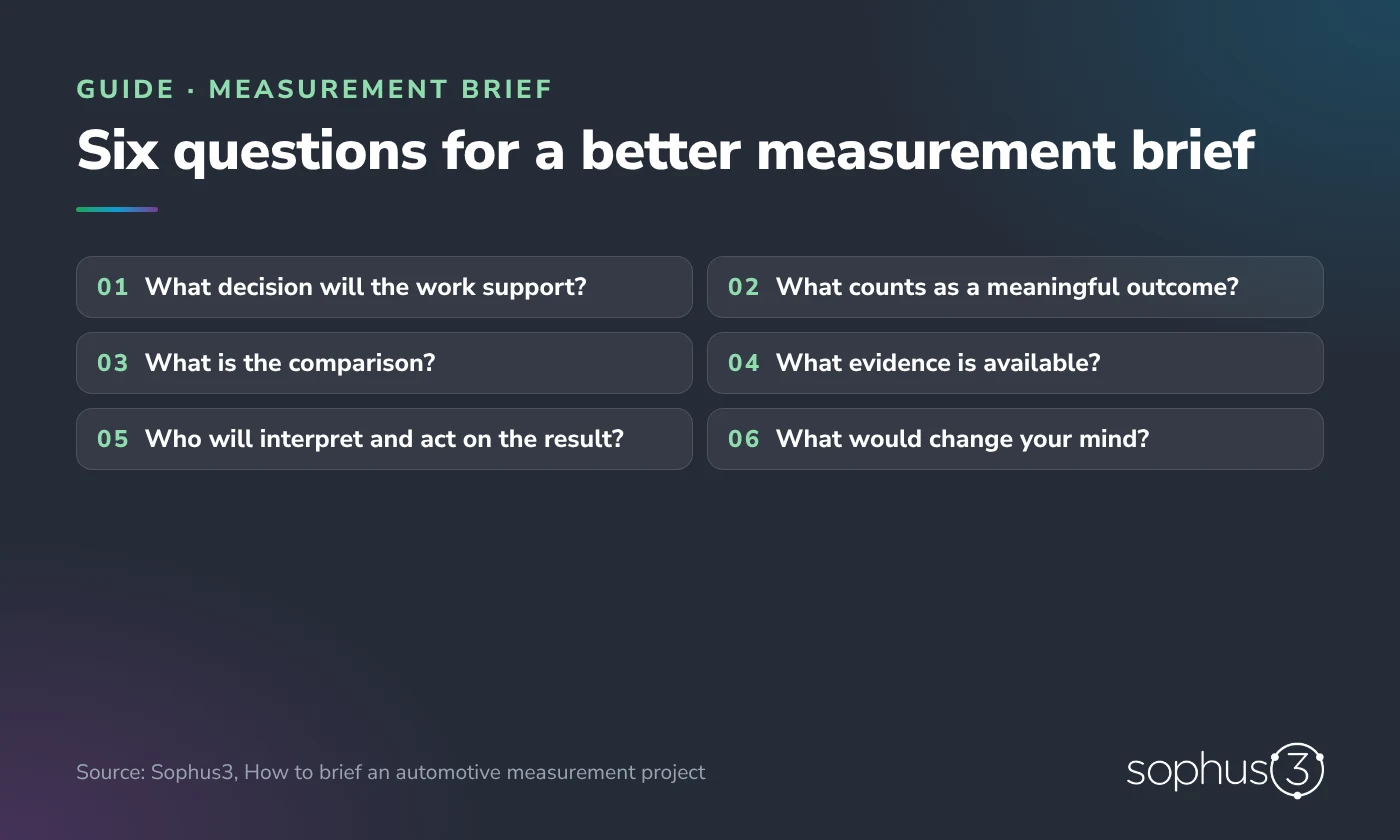
“Measure the campaign” is not a brief. Write down the decision the results will inform: keep, cut or move budget between channels; choose which model or market gets the next flight; decide whether a new creative route goes national.
Then write what you would do if the result were strong, weak or inconclusive. If every outcome leads to the same action, you are commissioning a report, not decision support.
Be clear about the type of campaign. Brand work changes consideration over months, so its evidence is shifts in research and share over time. Model and tactical activity should move model research, configurations and enquiries within weeks. Judging one by the other’s yardstick is the most common reason good campaigns are cut.
Step 2: Map the buying journey to observable signals
Car buying is long and non-linear, and most of the research happens online before anyone visits a showroom. Map each stage to signals you can actually observe:
- Interest: branded and model search, new and returning visitors to the brand site, research on review sites and marketplaces.
- Consideration: model-page visits, gallery and specification engagement, comparisons, configurator starts, return visits.
- Intent: configurator completions, price and finance calculators, stock-locator searches, dealer-locator use, brochure and test drive requests.
- Conversion: qualified leads, reservations and orders, and sales matched back to leads in CRM.
Note where each signal lives: on the brand site, on dealer and partner sites such as marketplaces and finance providers, or only in CRM. The joins between those systems are where most automotive measurement breaks.
Step 3: Choose KPIs for each stage, and one that decides
Pick one or two KPIs per stage, then a single deciding metric that matches the campaign objective:
- For a brand campaign, use a relative measure such as digital market share, the brand’s share of visits among its competitor set, or its share of model research in the segment.
- For a model or tactical campaign, use high-intent actions per exposed in-market buyer: configurations, test drive requests, stock searches.
- For lead generation, agree a definition of a qualified lead with sales before launch, and track lead-to-sale, not lead volume alone.
Leave out metrics that move for reasons unrelated to the campaign. Page views, time on site and raw clicks change with site design, consent rates and bot traffic as much as with advertising.
Step 4: Set the baseline and the competitive context
Absolute numbers mislead in automotive. Demand moves with the season, registration-plate changes, model launches, incentives and fuel prices. Sophus3 data has shown EV research jump when fuel costs rose and when Germany changed its EV incentives, for reasons that had nothing to do with any one brand’s advertising.
So measure relative to the market. Digital market share shows whether you grew or the whole market did. When Hyundai sponsored the FIFA World Cup, its European digital audience share still fell year on year. That is a signal, not a verdict: competitor launches and incentives move share too. It is exactly why the comparison has to be agreed in advance.
Before launch, fix the comparison: a prior period, a comparable market, a named competitor set or an unexposed audience. Write it into the plan so nobody chooses the flattering baseline afterwards.
Step 5: Pick a method that can show cause
Different questions need different methods. State the limits of the one you choose in the plan.
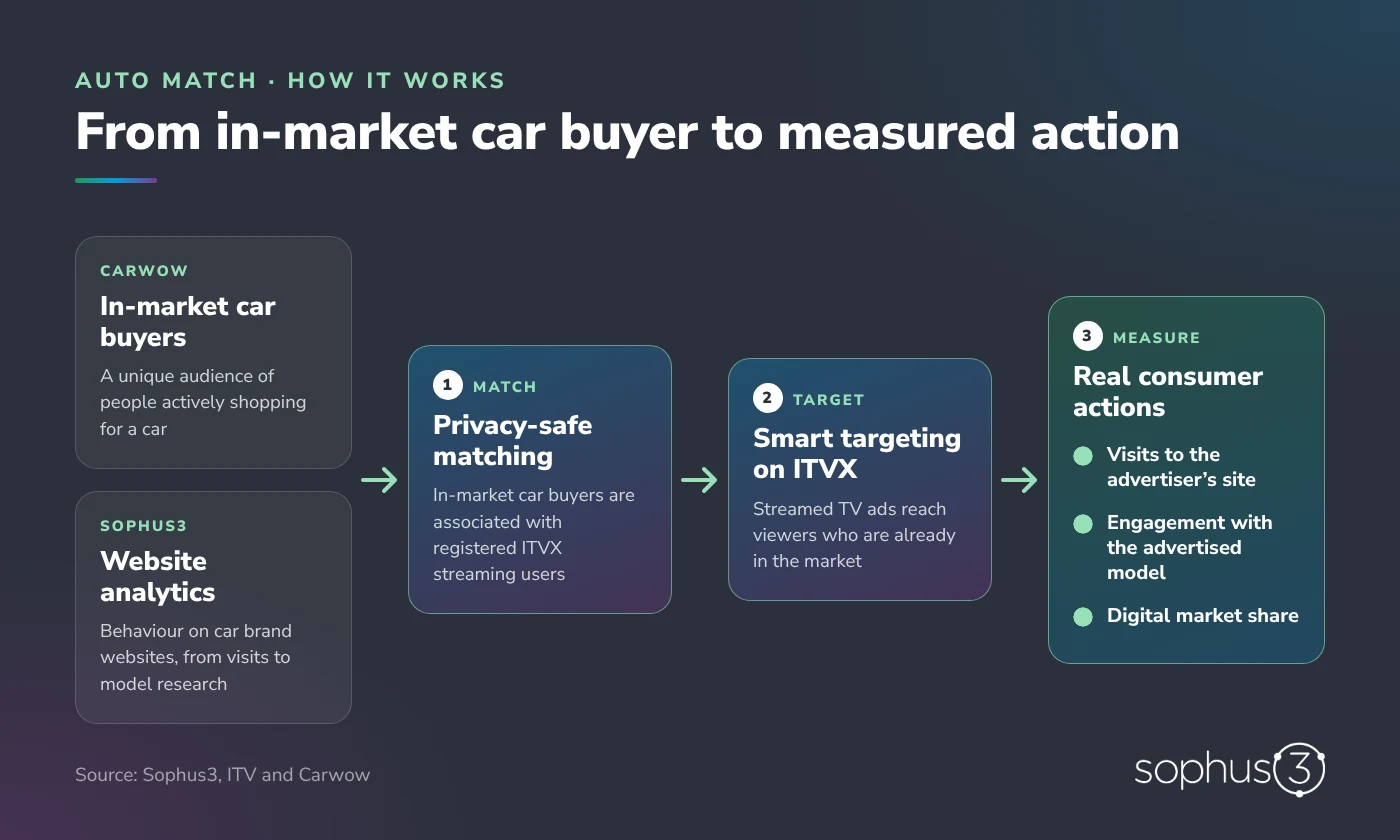
- Exposed versus unexposed: compare people who saw the ad with similar people who did not. This is how Auto Match measures ITVX campaigns: across more than 12 months, exposed viewers were 181% more likely to visit the advertiser’s site than the average visitor. Best for addressable TV, streaming and digital.
- Market or regional tests: run in some areas and hold others back. Useful for outdoor, radio and retail activity that cannot be targeted to individuals.
- Before and after, with a competitor control: compare your change with the competitor set’s change over the same weeks. Cheap and quick, but weaker when competitors launch at the same time.
- Marketing mix modelling: for long-term budget allocation across channels. It needs years of history and is not a tool for in-flight decisions.
- Click-based attribution: fine for digital housekeeping, but it credits the last click and undervalues the brand and model advertising that creates future demand. Do not use it to judge TV or brand campaigns.
Step 6: Fix tracking and consent before launch
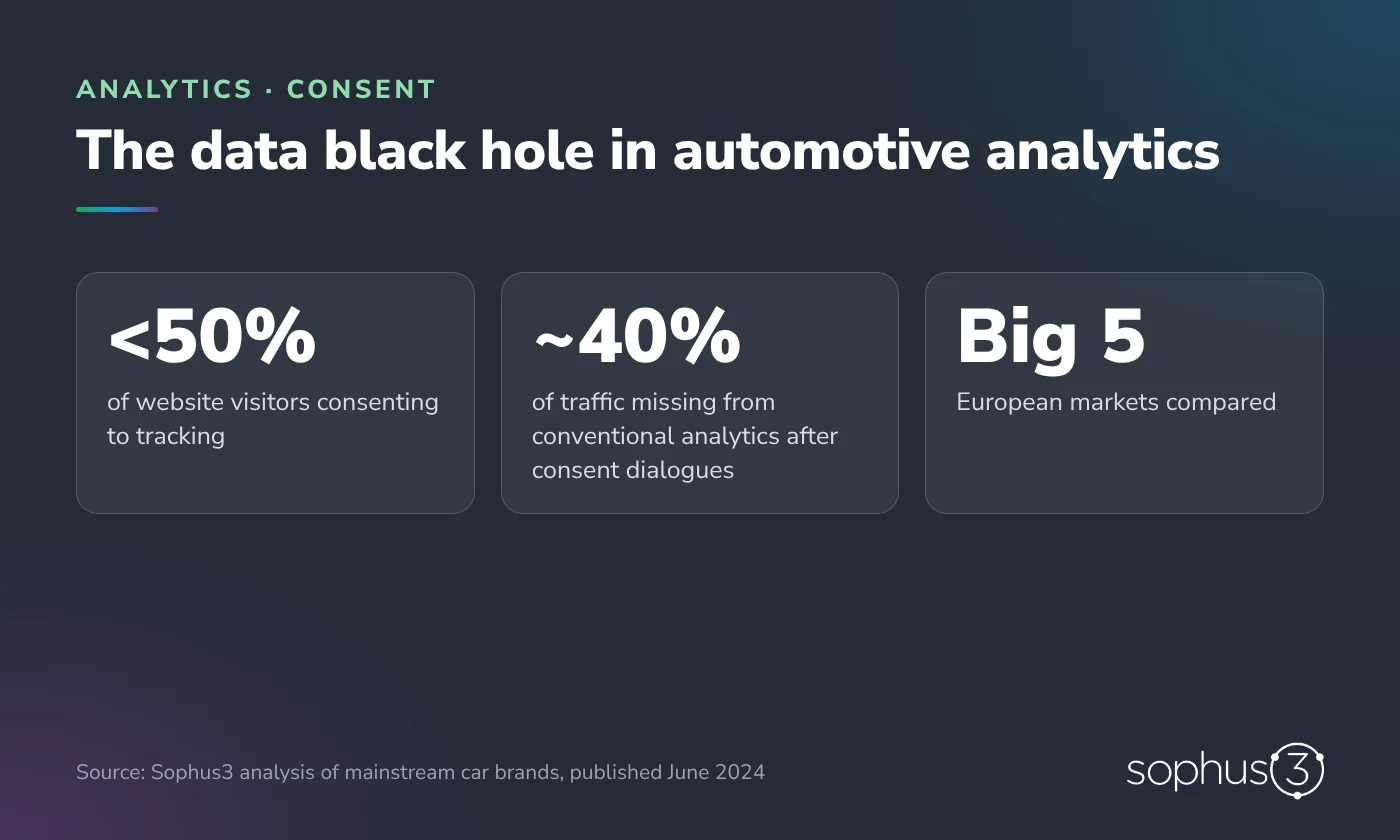
In Sophus3’s analysis across mainstream car brands in the five largest European markets, fewer than half of website visitors consented to tracking, and roughly 40% of traffic disappeared from conventional analytics once consent dialogues were introduced. A campaign measured only through consented analytics can look weaker, or stronger, than it was.
- Write the tagging plan from the KPIs in step 3, not from the site map.
- Check consent rates by market, and use lawful consent-free measurement or modelling to fill the gap.
- Track across domains: brand site, configurator, stock and dealer locators, finance and partner sites.
- Use one set of campaign parameters across every agency and market.
- Test events against real journeys before launch, not after the first report.
- Harmonise definitions across markets, so a lead in Spain means the same as a lead in Germany.
Step 7: Report for the next decision
Run two rhythms. In flight, review a few leading indicators each week to catch problems early: tracking breaks, the wrong audience, a broken landing page. After the campaign, produce one read-out against the decision from step 1: the comparison used, the size of the effect, how confident you can be, and what you would do next.
Say plainly when a result is inconclusive. A clear “we cannot tell yet, and here is what would settle it” is more useful than a confident number built on a weak baseline.
Finally, add the newest part of the journey. Buyers increasingly research cars through AI assistants. Track how your brands and models appear in AI answers to the questions buyers ask, alongside your share of real digital demand. In the UK, Chinese brands’ share of AI visibility rose from around 15% in 2025 to almost 25% in 2026, while they attract about one in ten visits to car brand websites. AI answers and website demand do not move together, so measure both.
A worked example: an EV model launch in three markets
This is an illustrative example of the framework in use, not a client result.
- Decision: which of three markets receives extra budget in the second wave.
- Signals: model-page visits, configurator completions, test drive requests and EV running-cost calculator use.
- Deciding metric: test drive requests per thousand exposed in-market buyers, compared with similar unexposed buyers.
- Baseline: eight weeks before launch, plus the brand’s digital market share within a named set of six competing EV models.
- Method: exposed versus unexposed for streaming and online video; before and after with a competitor control for outdoor.
- Tracking: the configurator and the dealers’ test drive form sit on different domains, so cross-domain tracking and consent rates are checked in each market before launch.
- Read-out: one market shows a clear uplift and receives the extra budget; another is inconclusive because a national incentive changed mid-campaign, so spend is held until the next read.
Pre-launch checklist
- The decision the results will inform is written down, with what you will do for each outcome.
- Campaign type is agreed: brand, model or tactical.
- Journey stages are mapped to signals, with the system each one lives in.
- One deciding metric and no more than two KPIs per stage.
- The baseline, comparison and competitor set are agreed in writing.
- The method is chosen and its limits are stated.
- The tagging plan follows the KPIs and has been tested on real journeys.
- Consent rates are known for each market, with a plan for the gap.
- Campaign parameters and lead definitions are harmonised across agencies and markets.
- The read-out date, owner and format are booked before launch.
Mistakes we see most often
- Judging a brand campaign on last-click leads.
- Reporting absolute traffic without the market context.
- Switching the baseline after seeing the results.
- Discovering broken tracking in the first post-campaign report.
- Treating “inconclusive” as failure, then cutting the budget anyway.
Talk it through
If you are planning a campaign and want a second view on the framework, talk to Sophus3. You can also read how to brief an automotive measurement project, the Auto Match case study and why consent matters for automotive analytics.
Questions people ask
How do I build a measurement framework for an automotive digital brand campaign?
Start with the decision the results will inform, map the car-buying journey to signals you can observe, choose one deciding metric, agree the baseline and competitor set before launch, pick a method that can show cause, fix tracking and consent first, and report against the original decision.
Which KPIs matter most for automotive digital campaigns?
It depends on the campaign. Brand campaigns are best judged on relative measures such as digital market share or share of model research. Model and tactical campaigns should be judged on high-intent actions, such as configurations and test drive requests, per exposed in-market buyer.
How do you measure the effect of TV or streaming advertising on car buyers?
Compare people who saw the ad with similar people who did not, then track what each group did next: site visits, model research, configurations and enquiries. Auto Match, run by ITV and Carwow with Sophus3 as measurement partner, measures ITVX campaigns this way.
How much data do car brands lose to cookie consent?
In Sophus3’s analysis of mainstream car brands in the five largest European markets, fewer than half of visitors consented to tracking, and around 40% of traffic disappeared from conventional analytics after consent dialogues were introduced.
What is digital market share in automotive?
Digital market share is a brand’s share of visits to car brand websites within its competitor set. Because it is relative, it shows whether a brand grew faster than the market, which absolute traffic cannot.
Should automotive brands measure visibility in AI assistants?
Yes. Buyers increasingly research cars through AI assistants, so brands should track how their brands and models appear in AI answers to real buyer questions, and compare that with their share of digital demand.
Figures quoted come from Sophus3 analyses published on this site: consent and data loss (June 2024), Auto Match campaign analysis (October 2026) and AI visibility in the UK (September 2026). The worked example is illustrative.